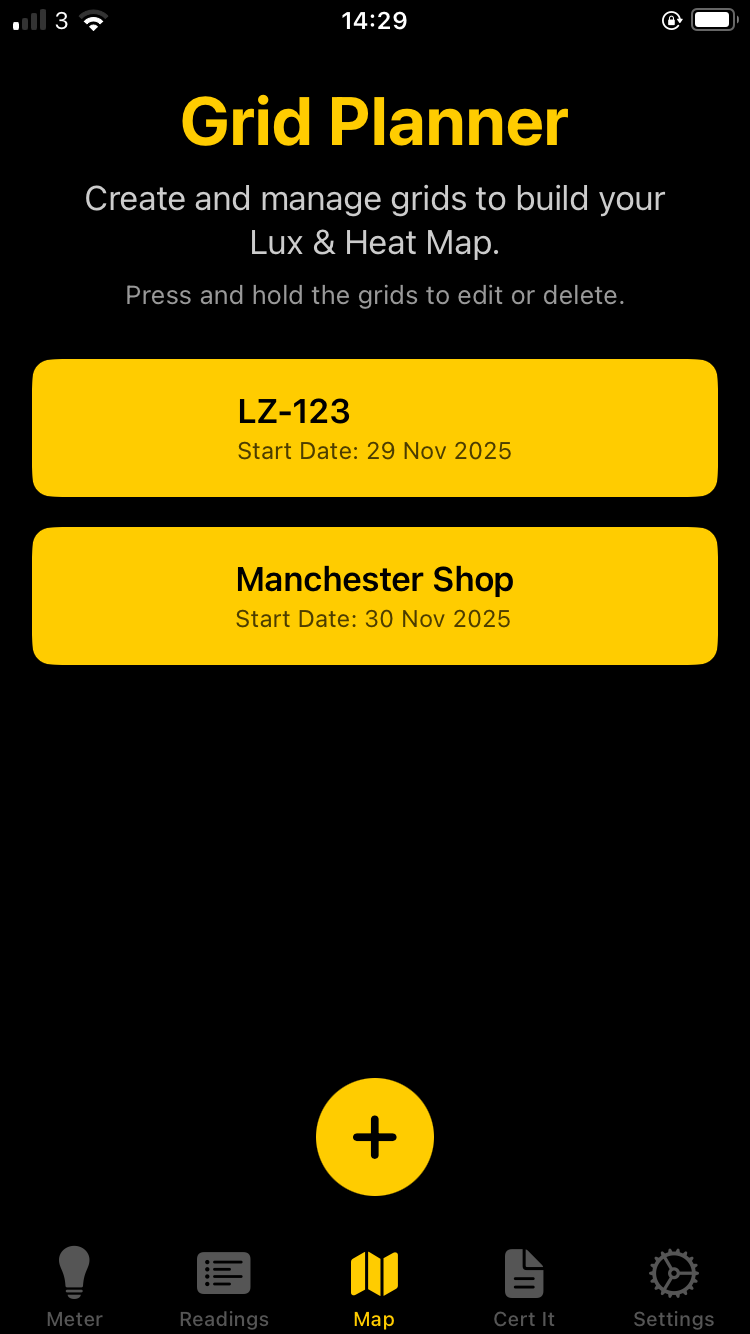
1. Create a Grid for Your Room
Start by creating a new grid for the room you’re assessing. Give it a job reference and basic address details so your lux map is always tied back to a real project and location.
Define the job and grid ID
In the app, the CreateGridView screen lets you create a new lighting grid with:
- Job reference – a name you recognise (project, room, client).
- Business/Resident name and address – for clear reporting.
- Automatic Grid ID – a unique ID (UUID) stored as
gridIdused to link your CSV data and PDF reports to this grid. - Start date – when you began the survey or design work.
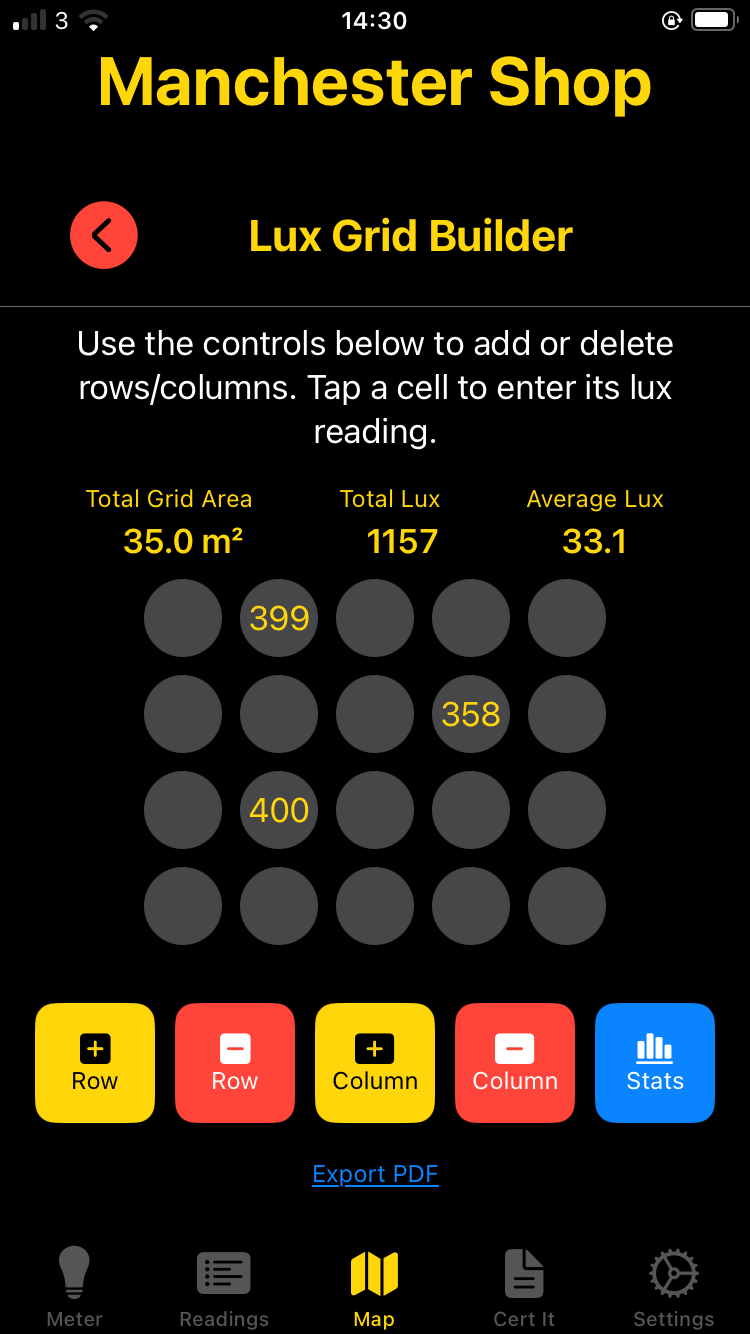
When you tap “Create”, Lux Meter Pro:
- Saves the grid metadata into a local
grids.jsonfile. - Creates a matching
gridId.csvwith row/column placeholders for lux values.